Single-trial Toolbox: STEP1
In 2010 we developed a method for the automatic estimation of the latency and amplitude of the N1 wave of laser-evoked potentials (LEPs) in single trials (for the full text of the publication describing this method [Hu et al, "A novel approach for enhancing the signal-to-noise ratio and detecting automatically event-related potentials (ERPs) in single trials", NeuroImage 2010], click here).
The approach, summarized in the figure below, consists of two consecutive steps: wavelet filtering and multiple linear regression.
STEP1 is a free software for the automatic and unbiased extraction of different features of EEG signals in the time domain. STEP1 includes and expands the features of our previous 'N1measure' algorithm (which is now obsolete).
STEP1 is useful both for measuring single-trial stimulus-evoked potentials and epileptiform activities in the human EEG. The full-length paper (Hu et al "Taking into account latency, amplitude and morphology: improved estimation of single-trial ERPs by wavelet filtering and multiple linear regression", Technical Report in Journal of Neurophysiology 2011) describing the approach can be downloaded here.
Please download the toolbox from here: STEP.rar (11.0MB). The .rar archive also contains a user manual.
Should you have any issue with installing or running the toolbox, or any related question, please email us at: [email protected] and [email protected].
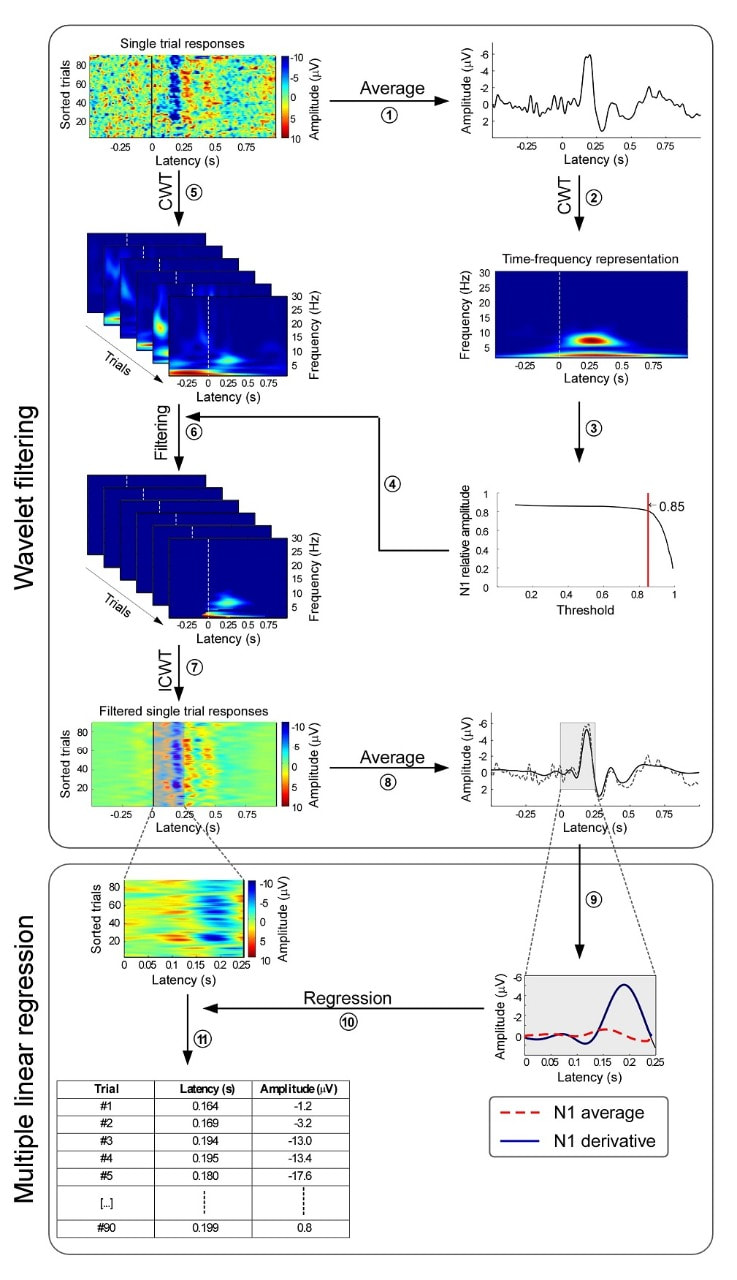
Figure. Flowchart describing the procedure developed to enhance the signal-to-noise ratio of the N1 wave of LEPs (top panel), and to measure automatically its peak latency and amplitude in single trials (bottom panel).
Top panel: A time-frequency representation is obtained from the group average waveform, using a continuous wavelet transform (CWT) (1), and a wavelet filter is generated by thresholding this time-frequency representation (2). This filter is applied (3) to the time-frequency representation obtained from single-trial LEP responses (4). Filtered single trial LEP responses are then reconstructed in the time-domain using an inverse CWT (ICWT) (5), and finally averaged (6). This procedure generates both single-trial (5) and averaged (6) LEP responses with enhanced signal-to-noise ratio.
Bottom panel: A multiple linear regression is applied to these single-trial LEPs with enhanced signal-to-noise ratio to obtain a fast and unbiased estimate of the peak latency and amplitude of N1 waves. A regressor and its temporal derivative (0 to 0.25 s post-stimulus) are obtained from the across-trial average waveform (7). This basis set is then regressed (8) against the corresponding time window of each single LEP trial, thus yielding (9) a latency and amplitude value for each N1 peak.